The Challenge
Managing numerous stakeholders throughout our work including IT, Communications, San Jose 311 service owners representing five City departments, residents via Council offices, and a team of Google fellows on their own mission to rebrand My San Jose to San Jose 311.
What We Did
Led UI/UX improvements for the SJ311 website and mobile app through creating user flows, prototypes, usability testing, icon & label testing, user acceptance testing (UAT).
Led process improvement implementation for backend Salesforce staff-facing interface. Facilitated a co-creation workshop where staff co-designed and built new interface in real-time.
Enforced WCAG 2.0 AA level accessibility standards and City brand guidelines.
The Result
56% decrease in number of anonymous reports via web. Anonymous reports complicate triaging for service requests and lead to more unresolved requests.
21% decrease in number of "unable to locate" service requests on the backend for the illegal dumping team - from ~56 to ~44 per week.
9% increase in average number of work orders distributed by one staff member per day.
43.3 vs 47.3 work orders distributed per day

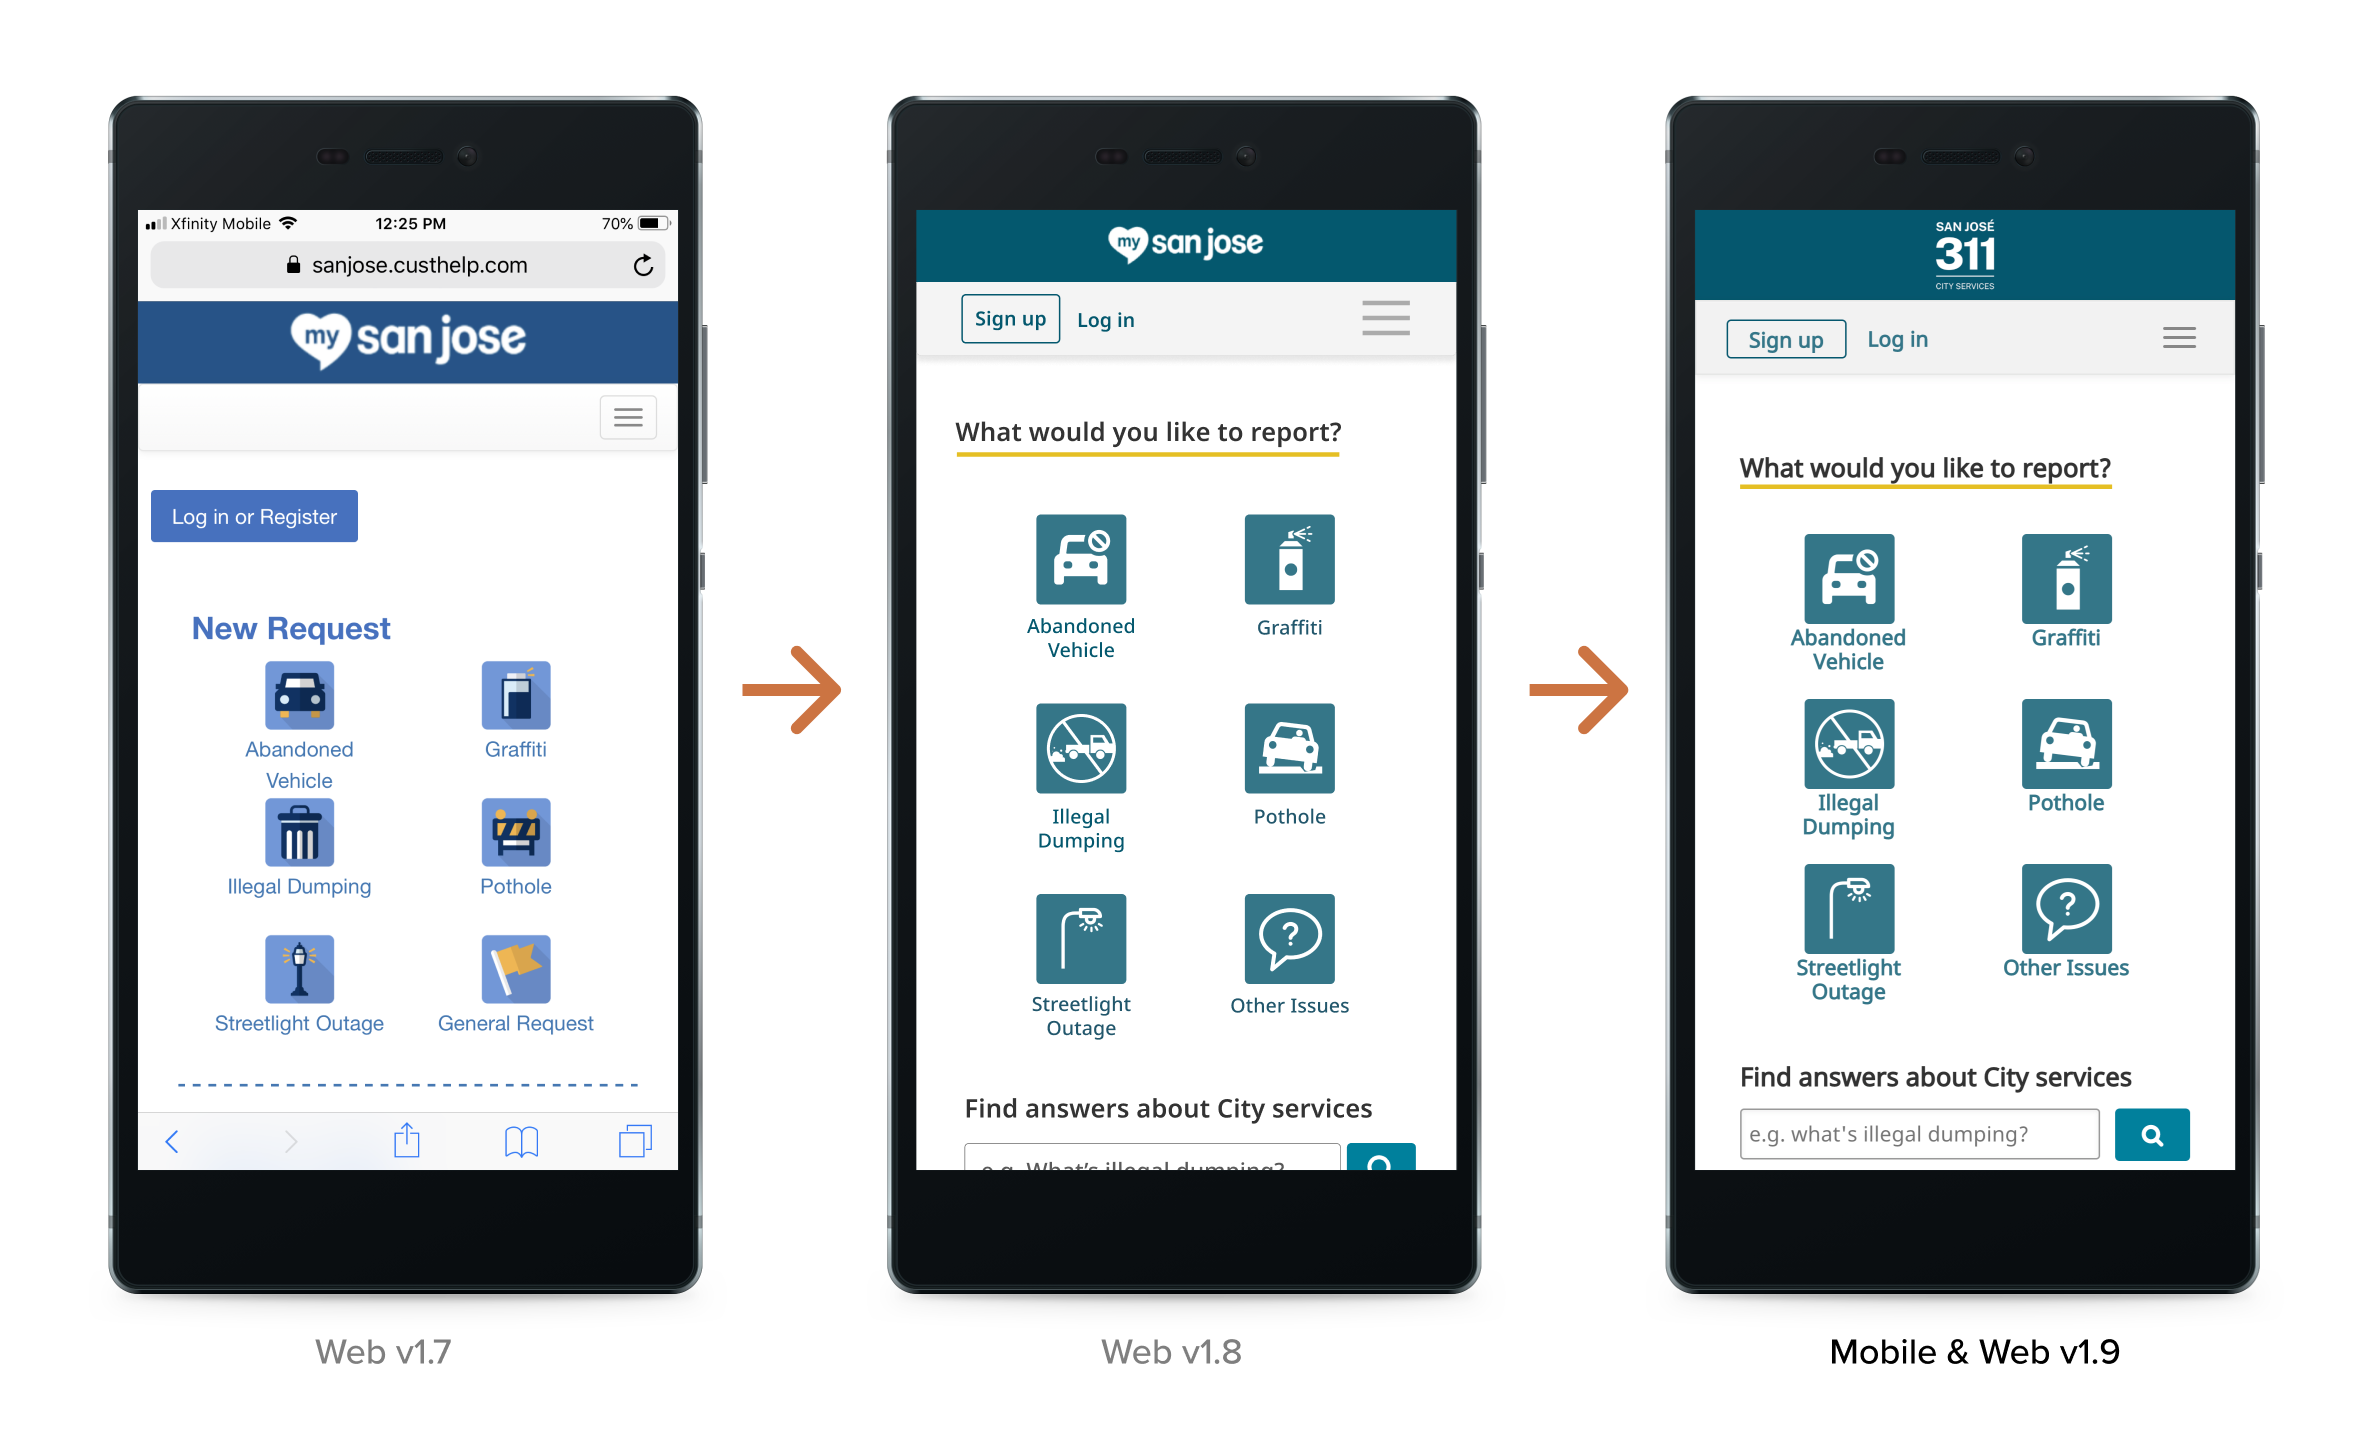

An example of a preference test conducted to decide on the most intuitively understood icons.


We started by interviewing and shadowing staff
We began preparing for the workshop by shadowing staff while they dispatched on a typical work day. We also interviewed them for better contextual understanding of their pain points.

We recorded a video of their screen while they dispatched
We learned that one work order requires anywhere between 2 to 5 minutes to process; they opened at least 6 tabs on their browser.

Subject matter experts and a Salesforce developer watched the video footage together…
Watching the video together was critical for building alignment and momentum. We all understood the pain points together.

Then we co-created a service blueprint and then implemented a new map right then and there
The service blueprint was also key. The developer started coding right away. Everyone on the team was excited. Our work led to a 9% increase in average number of work orders distributed by one staff member per day.